
Unveiling Trends in Steam Video Games: A Decade of Insights (2013-2023)
Part 1
Disclaimer: The original dataset used for this analysis was sourced from https://www.kaggle.com/datasets/fronkongames/steam-games-dataset . The data was cleaned and prepared using MySQL and Tableau. For more detailed information regarding the data cleaning and filtering processes, please refer to the Appendix section.
Introduction
Welcome to my deep dive into the world of Steam video games! Over the past decade, the gaming industry has seen tremendous growth and transformation. I would like to share insights derived from a comprehensive dataset of 60356 games (after data cleaning) released on Steam between 2013 and 2023. We’ll explore trends in game releases, genre popularity, review patterns, and market demand. Part 1 focuses on an exploratory analysis of released games, examining what types of games (genres and tags) are available. Part 2 looks at reviewed games, analyzing what types of games are popular based on positive and negative reviews. Finally, Part 3 presents a comparative analysis of released and reviewed games to identify market demand trends.

Yearly Trends in Game Releases
One of the first insights we can look at is the trend in the number of games released each year. The graph below shows a steady increase in game releases, with notable spikes during Covid-19 lockdown. This trend highlights the growing popularity and accessibility of game development.
Overview
- Steady Growth (2013-2017): The number of game releases on Steam increased dramatically from 450 games in 2013 to 6,039 in 2017. This period represents a time of exponential growth, likely driven by the increasing accessibility of game development tools (like Unity and Unreal Engine), and Steam’s more open publishing policies after Greenlight.
- Peak Years (2018-2021): The highest number of releases was in 2020, with 8,971 games. This period corresponds with the COVID-19 pandemic, where global lockdowns led to a surge in both game development (due to remote work) and gaming consumption, pushing more developers to release new games.
- Decline (2022-2023): After the 2020 peak, game releases began to decline. In 2023, the number dropped to 6,336, potentially due to the economic slowdown post-COVID, supply chain issues affecting development tools, and a possible saturation of the market as developers faced more competition.
Analysis
The COVID-19 pandemic played a key role in the peak seen in 2020. While more developers may have focused on creating games during the lockdown, the market now faces challenges. This could include delayed projects, increased development costs, or studios focusing on fewer but higher-quality releases. The decline after 2021 may also reflect economic adjustments and shifts in the industry, as developers deal with changing player expectations and market saturation.

Genre Distribution Over Time
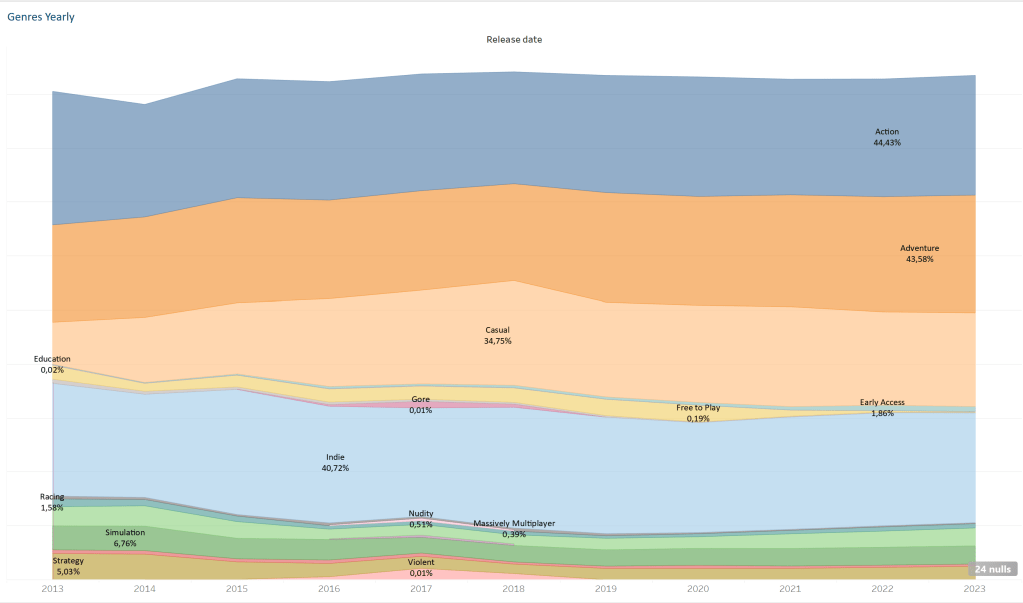
Genres play a crucial role in defining a game’s identity. By examining the genres of released games distribution over the years, we can see how publishers and developers preferences have evolved. The stacked area chart below illustrates the rise and fall of various genres, providing a clear picture of moving trends. Here are the key findings:
- Dominant Genres:
- Action consistently remains the most dominant genre, with percentages hovering around 40% to 44% throughout the decade. It peaked slightly in 2023 at 44.43%.
- Indie is also consistently popular, with a high share around the 40% mark, peaking at 46.37% in 2015 and maintaining a strong presence.
- Adventure shows steady growth, reaching its peak in 2022 at 42.64%, indicating sustained interest in narrative-driven games.
- Significant Trends:
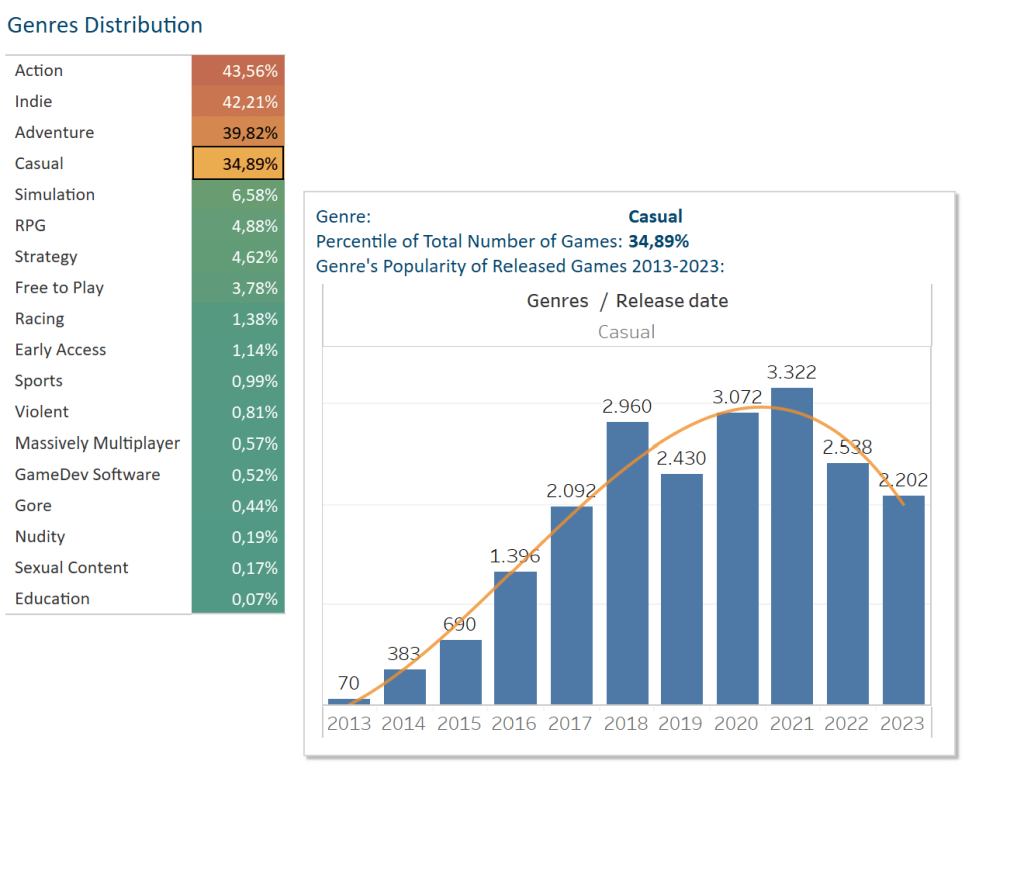
- Casual Games saw substantial growth from 2013, peaking in 2018 at 38.73%, but then showing some decline in recent years, stabilizing around 34-37%.
- Simulation is although not as dominant, this genre has seen a gradual decrease from 8.89% in 2013 to 6.76% in 2023, with fluctuations along the way.
- RPG has remained relatively stable, with a slight increase over the years, peaking in 2023 at 6.64%.
- Emerging and Declining Genres:
- Early Access has slowly gained traction, showing steady growth from 0.22% in 2013 to 1.86% in 2023, indicating the rise of games released in beta or pre-release formats.
- Free to Play experienced significant fluctuations, with a peak in 2020 at 6.23%, but has dramatically declined since, dropping to 0.19% in 2023.
- Strategy and RPG both show gradual growth, with strategy games peaking at 5.03% in 2023.
- Niche or Declining Genres:
- Sports, Racing, Massively Multiplayer: These genres have remained niche, with relatively low percentages throughout the decade, suggesting stable but limited popularity.
- Violent, Gore, Nudity, Sexual Content: Remain extremely niche, with negligible percentages, reflecting perhaps regulatory or market shifts away from these genres.
Conclusion:
The gaming industry has shown strong and consistent interest in Action, Indie, and Adventure genres, which dominate the market. While Casual games have seen fluctuations, they remain a significant portion of the market. Emerging trends like Early Access games reflect evolving player preferences and industry practices, while niche genres like Sports, Racing, and Violent games remain specialised. The decline in Free to Play titles in recent years could indicate market saturation or shifting consumer interests. Overall, the data suggests a stable yet dynamic market, with certain genres solidifying their dominance and others emerging or declining based on broader industry trends.
Tag Trends and Popularity
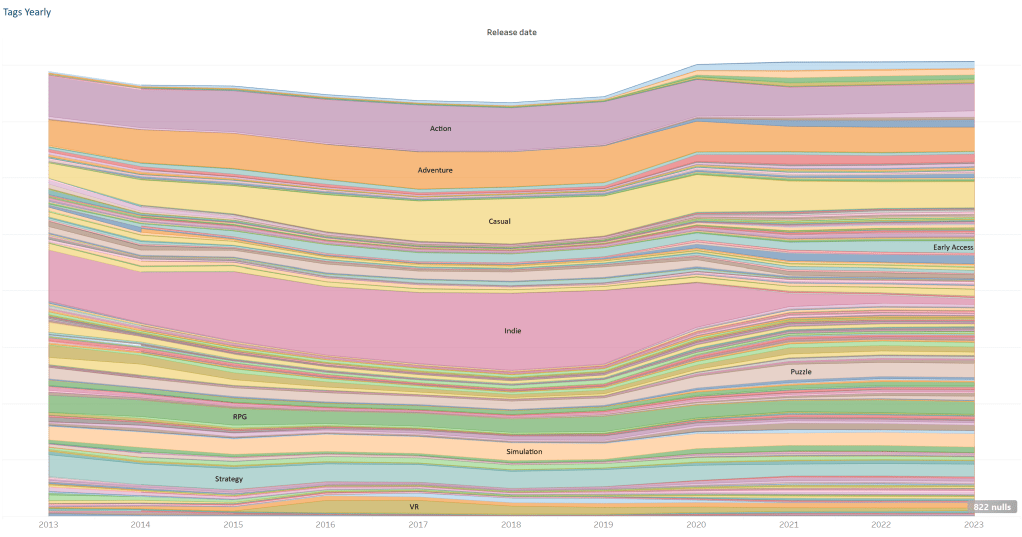
This graph shows the yearly distribution of various tags used for games released on Steam from 2013 to 2023. The size of each tag’s band reflects its relative prominence each year, illustrating the rise and fall of different gaming trends.
Overview and Key Trends:
- Action, Adventure, and Casual Dominance: From 2013 onwards, Action, Adventure, and Casual games have consistently held the largest share of tags. These genres have maintained steady popularity, indicating their broad appeal and central role in the gaming market over the years.
- Rise of Indie Games: Indie games had a significant presence throughout the period, especially in the earlier years (2013-2016). This reflects the boom in independent game development during this time, as more tools became available for smaller studios or solo developers to create and publish their games.
- Emerging Tags (2016 and beyond): From around 2016, tags like VR, Roguelike, and Survival started gaining momentum. The increased use of VR tags corresponds with the rise of VR gaming platforms and hardware, while Roguelike and Survival games became more popular as developers experimented with new and challenging game mechanics.
- Stable Niche Genres: Several niche tags, such as RPG, Strategy, and Simulation, remained consistently present across the years. These genres, while not dominating, have a dedicated player base that ensures their steady inclusion in game releases.
- Specialized and New Trends: Over time, newer and more specific tags like Precision Platformer, PvP, and Deckbuilding began to emerge. This points to a diversification of game genres as developers cater to more specialized tastes, creating games with unique mechanics and focused experiences.
- Decline of Certain Tags: Some tags, such as Multiplayer and Crowdfunded, saw more prominence in the earlier years but gradually faded. This could reflect changes in funding models for games and shifts in player preferences toward single-player or co-op experiences rather than large multiplayer titles.
Analysis:
This graph highlights the evolving nature of the gaming industry on Steam. While core genres like Action, Adventure, and Casual remain popular, emerging technologies like VR and unique gameplay styles like Roguelike and Survival have shaped the market in recent years. Indie games saw a major surge, showing the rise of independent game development, while niche tags have carved out their space as players increasingly seek specialized game experiences. The graph underscores the dynamic and ever-changing landscape of gaming trends.


Tag-Genre Relations
Key Observations:
The total number of tags across all genres has increased from 223 in 2013 to a peak of 416 in 2021. There is a slight decline to 406 tags in 2023.
General Trends:
- Overall Growth: Most genres have seen a significant increase in the number of tags over the decade, indicating a growing diversity and interest in various game types.
- Peak in 2020-2021: Many genres reached their peak number of tags around 2020-2021, possibly due to increased gaming activity during the COVID-19 pandemic.
- Slight Decline Post-2021: A slight decline in tags for several genres post-2021, which could be due to market saturation or shifting interests.
Interpretation of Increased Tags:
- Popularity: More tags suggest that a genre is becoming more popular among players. This could be due to an increase in the number of games being released in that genre or a growing interest from the gaming community.
- Diversity: Reflects a greater diversity of games within that genre. Developers are exploring more themes, mechanics, and styles within that genre, offering players a wider variety of experiences.
- Market Trends: The rise in tags can signal market trends and shifts in player preferences. For example, if a genre like “Simulation” sees a significant increase in tags, it might indicate that more players are looking for immersive, realistic gaming experiences.
- Developer Focus: Shows where developers are focusing their efforts. If a genre like “Indie” is seeing more tags, it might suggest that more independent developers are entering the market and creating games in that genre.
- Cultural Impact: Linked to broader cultural trends.
Appendix
Data Cleaning Process
Tools Used: MySQL for initial data cleaning and Tableau Prep for further processing and visualization.
Steps Taken:
Initial Cleanup in MySQL:
Creating Clean Table: Created a new table games_06_24_clean to store the cleaned data. This step ensured that the original data remained intact while working on the cleaned version.
SQL
CREATE TABLE games_06_24_clean LIKE games;
INSERT INTO games_06_24_clean SELECT * FROM games;
Removing Null Values: Deleted rows where critical columns like name, Developers, Publishers, Categories, Genres, and tags were null. This was done to ensure data quality and relevance.
SQL
DELETE FROM games_06_24_clean WHERE name IS NULL;
DELETE FROM games_06_24_clean WHERE Developers IS NULL AND Publishers IS NULL;
DELETE FROM games_06_24_clean WHERE Categories IS NULL AND Genres IS NULL AND tags IS NULL;
Dropping Unnecessary Columns: Removed columns that were not needed for the analysis (Screenshots, About_the_game, Reviews, Header_image, Metacritic_url). This helped reduce the size of the dataset and improve performance.
SQL
ALTER TABLE games_06_24_clean DROP COLUMN Screenshots, About_the_game, Reviews, Header_image;
ALTER TABLE games_06_24_clean DROP COLUMN Metacritic_url;
Final Selection: Selected all remaining columns to verify the cleaned data.
SQL
SELECT * FROM games_06_24_clean;Splitting Columns: Used MySQL to split tags and genres columns, which contain multiple values separated by commas, into individual values. This step was only used for the initial exploratory analysis to understand the database’s contents and what exactly could be harvested from it. The following code is a simplified example:
SQL
SELECT
  SUBSTRING_INDEX(SUBSTRING_INDEX(tags, ',', numbers.n), ',', -1) AS split_tag
FROM games
CROSS JOIN (SELECT 1 AS n UNION ALL SELECT 2 UNION ALL SELECT 3 UNION ALL SELECT 4 UNION ALL SELECT 5 UNION ALL SELECT 6 UNION ALL SELECT 7 UNION ALL SELECT 8 UNION ALL SELECT 9 UNION ALL SELECT 10
            UNION ALL SELECT 11 UNION ALL SELECT 12 UNION ALL SELECT 13 UNION ALL SELECT 14 UNION ALL SELECT 15 UNION ALL SELECT 16 UNION ALL SELECT 17 UNION ALL SELECT 18 UNION ALL SELECT 19) AS numbers
ON CHAR_LENGTH(tags) - CHAR_LENGTH(REPLACE(tags, ',', '')) >= numbers.n - 1;
Further Processing in Tableau Prep:
Pivoting Columns: I used Tableau Prep to split and pivot tags and genres columns for better visualization before connecting database to the Tableau Desctop. This step was necessary because Tableau Desktop does not support pivoting on calculated fields, and pivoting allows for more flexible and insightful visualizations.
